Studies
What the 2025 Federal Judicial Caseload Numbers Tell Us About Litigation Demand
A data study of 2025 federal filings across the district courts, courts of appeals, and bankruptcy courts, with figures drawn from uscourts.gov.
Blog archive
Our studies are the research arm of this directory. Each one starts with a public dataset that almost nobody reads in full, and ends with a picture of the American legal market that you can check line by line. We do not summarize other people’s reporting. We pull the tables ourselves, from uscourts.gov, the ABA National Lawyer Population Survey, the NCSC Court Statistics Project and state discipline agencies, and we show our arithmetic.
The series exists because the legal industry runs on received wisdom. Everyone knows that BigLaw is growing, that solos are struggling, that courts are drowning. Some of that is true. Some of it collapses the moment you open the caseload spreadsheets. Our federal caseload study found litigation demand rising in bankruptcy while several district courts got quieter. The state court study showed that the real volume story is not criminal trials at all. It is traffic, debt collection and a flood of people representing themselves. You would not guess either fact from the headlines, and both change how you read every “courts in crisis” story published this year.
So far the studies cover six territories. Where federal filings actually grew, and where they did not. How the 1.3 million licensed US lawyers distribute across states and counties, including the counties with no lawyer at all. How attorney discipline works in each of the fifty states, court-run in some, bar-run in others, with sanction ladders that differ more than most lawyers realize. What state court dockets are really made of. Where the lawyer pipeline leaks, from law school applications through bar passage to first jobs. And how the firm market is structured, from the solo majority to the hundred firms that collect a wildly outsized share of total revenue.
A word on method, because it is the whole point. Every study names its sources, states its cut-off dates and explains what the numbers cannot tell you. When a dataset has a known weakness, and most public legal data does, we say so in the text instead of hoping nobody asks. If we interpolate, you will see the word. This is slower than writing around a press release, and it shows in the publishing pace: we release a handful of studies a year and revise them when the underlying tables update, rather than pushing something thin every week.
Who are these for? Lawyers deciding where the demand actually is. Journalists who need a number they can defend. Firm managers benchmarking against the market rather than against the loudest competitor. Law students trying to see the profession they are about to enter without the recruiting gloss. And, honestly, anyone who has ever repeated an industry statistic and then wondered where it came from.
The studies also feed the rest of VerifiedLawFirms. The discipline research informs how we run quarterly bar-standing rechecks on listed firms. The geography work shapes how we think about coverage in underserved counties. Data research and verification turn out to be the same habit applied at different scales: do not assert what you have not checked.
Start with the study closest to your question, then follow its sources. Every chart links back to the raw table it came from, so you can disagree with our reading and build your own. That is not a courtesy. It is the standard we think legal market research should be held to, and the reason this category exists.
One more thing about independence, since research this specific invites the question of who pays for it. The studies are funded by the directory itself, not by firms, vendors or sponsors, and no listed firm sees a draft before you do. Nothing in the series exists to flatter a customer. When a finding cuts against our own interests, like data suggesting directories matter less in markets where every firm is thin on the ground, it ships anyway, because the series is only useful while it stays trustworthy. Research with a sales department attached is marketing, and the legal industry has enough of that already. These studies are our attempt at the other thing.
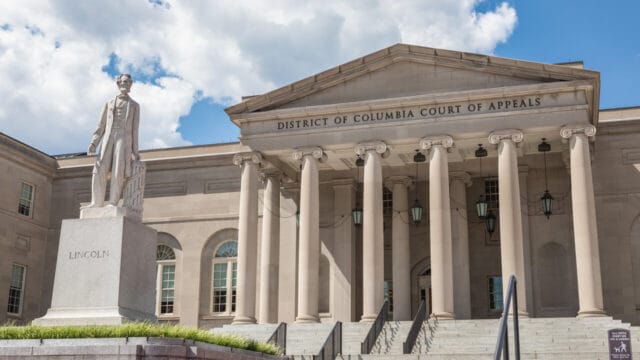
A data study of 2025 federal filings across the district courts, courts of appeals, and bankruptcy courts, with figures drawn from uscourts.gov.

A data study of the ABA National Lawyer Population Survey: where US lawyers concentrate, how density varies by state, and the rural counties that function as legal deserts.

A data study of lawyer discipline systems: court-run versus bar-run structures, public sanction ladders, reinstatement rules, and what published statistics reveal about enforcement variation.

A data study of NCSC Court Statistics Project figures on state court caseload composition, from traffic volume and debt collection to self-represented litigants and post-pandemic filing recovery.
A data study tracing the US lawyer pipeline from LSAC applicants and ABA 509 enrollment through bar passage and NALP employment, and where each stage narrows.
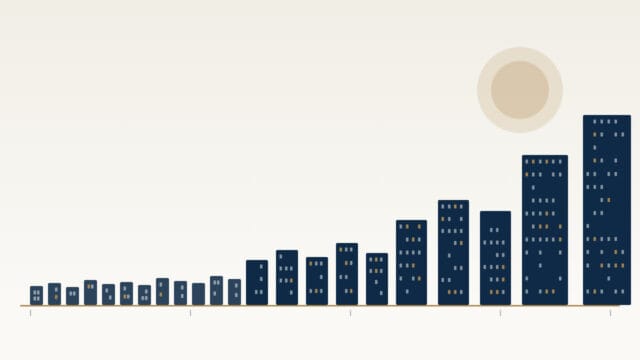
A data study of firm-size distribution, revenue concentration, the nonequity partner tier, and what a decade of Am Law and NLJ 500 rankings shows about consolidation.